
Activity review: a year for the record books
Transaction data from the KangaNews deal database highlight a year of many firsts in the Australasian debt market. From skyrocketing sovereign and semi-government issuance to major banks’ absence from the senior-unsecured space and a strong rebound for corporate issuance – 2020 was a year like no other.
Chris Rich Staff Writer KANGANEWS
Australian syndicated issuance in 2020 soared to record volume of A$240.5 billion (US$188.2 billion), almost twice the previous year’s total and nearly A$100 billion greater than any preceding year (see chart 1).
The key year-on-year change is a huge jump in government-sector issuance. Even excluding tenders and privately placed deals, semi-government issuance totalled A$42.6 billion – almost A$18 billion more than 2019’s record-breaking figure of A$24.7 billion – while the Australian Office of Financial Management shattered its syndicated issuance record (see chart 2).
The total of A$118 billion of Australian sovereign debt printed via syndication eclpised the total of A$109.2 billion from the past nine years combined. The AOFM executed A$84 billion via syndication in the second half of 2020 alone as it funded the federal government’s support of a battered economy.
Excluding sovereign and semi-government syndicated deals, however, the story of Australian dollar issuance is quite different. Volume from other issuers for the year was down significantly, to A$79.9 billion from A$99.8 billion in 2019, and at its lowest since 2011 (see chart 3). This can be explained much slowed pace from two sectors: financial institutions and the Kangaroo supranational, sovereign and agency (SSA) sector.
Kangaroo deal flow considerably lessened for the year, falling to A$20.4 billion from A$31.1 billion the year prior to reach its lowest point in the past 10 years (see chart 4).


An even more notable absence in the Australian dollar market was the domestic big-four banks. With significant deposit inflows and the Reserve Bank of Australia (RBA)’s term-funding facility (TFF) providing funding to authorised deposit-taking institutions (ADIs) at an interest rate of 0.25 per cent, cut to 0.1 per cent in November, the major banks have not had reason to call on debt capital markets for senior-unsecured funding.
Including issuance for capital purposes, the major banks only printed A$14.4 billion in 2020, down from A$30.6 billion in 2019 (see chart 5).
Australia-domiciled banks outside the big four had a greater call on debt capital markets in 2020, however. Australian dollar deal flow from nonmajor banks hit an all-time high with A$28.6 billion priced – just up from the previous record of A$27.6 billion in 2019 (see chart 6).
Not since the European sovereign-debt crisis has the volume of issuance by financial institutions been as low in the Australian dollar market, nor the composition of the issuance as diverse. Senior-unsecured supply fell to A$30.4 billion in 2020 from A$46.6 billion in 2019, while covered-bond issuance reached A$8.3 billion from A$2.5 billion the year prior – the lowest and highest volumes seen since 2012 (see chart 7).
While COVID-19 delayed tier-two issuance for a few months after March, banks were keen to get back on track for the ramp-up in total loss-absorbing capacity equivalent requirements with A$6.7 billion issued, up from A$5 billion in 2019. This was the highest volume of tier-two deal flow since 2012.
Conversely, Australian dollar issuance from the corporate sector experienced its second-largest volume ever. After H1 volume was fairly consistent with previous years, H2 2020 took off for a total print of A$11.5 billion that almost reached the bumper A$12.6 billion H2 in 2017 (see chart 8).


Volatility in March and April 2020 pushed many corporate issuers’ capital-market borrowing intentions into the second half of the year, when the historically low interest-rate environment made for attractive issuance conditions. The need for yield with a low cash rate in place forced investors to look further out on the credit and tenor curve for opportunities.
Indeed, corporate issuance of 10-year or greater duration reached a record high of A$7.9 billion in 2020 – up from A$3.6 billion in 2019 and easily surpassing 2017’s breakout year of A$6.1 billion (see chart 9).
A further encouragement for true corporate issuance in the Australian market is that triple-B, subinvestment grade and unrated deal flow for 2020, at A$9.8 billion, did not drop off from 2019’s record year despite heightened economic concerns (see chart 10).
Like the corporate market, Australia’s securitisation sector saw a drop-off in issuance in H1 due to COVID-19 volatility before rebounding to a level consistent with prior years (see chart 11).
Last year’s drop to A$34.3 billion of Australian dollar securitisation issuance, from A$44.1 billion in 2019, is largely explained by the absence of ADIs in the space. With the inflow of deposits and the RBA’s TFF, ADIs only issued A$8.1 billion of securitised product in 2020 versus an average of A$21.3 billion over the past nine years (see chart 12). Nonbanks had their largest-ever year in 2020 with A$26.2 billion printed, from the previous peak of A$23.5 billion in 2019.


Australian dollar green, social and sustainability (GSS) bond issuance took a back seat during COVID-19, however, with only A$7 billion issued versus 2019’s record A$10.2 billion (see chart 13).
GSS product from SSAs was the main source of the drop-off but the much talked about growth expectations of the corporate sector also failed to materialise. Financial institution and semi-government GSS issuance went some way to filling the gap.
NEW ZEALAND DATA
The New Zealand domestic market in 2020 was, like Australia, characterised by sovereign and subsovereign-agency issuance in response to growing funding requirements to combat COVID-19. New Zealand Debt Management printed a record NZ$23 billion (US$16.7 billion) via syndication, up from the typical NZ$1.5-4.5 billion in previous years (see chart 14).
Local subsovereign issuers executed NZ$5.2 billion of syndicated issuance, up from the record high of NZ$3.3 billion in 2019. Financial-institution paper was also notably absent from the New Zealand dollar market in 2020, down by more than NZ$3 billion to NZ$1.4 billion from NZ$4.5 billion in 2019. Kauri issuance hit an all-time high, however (see chart 15).
New Zealand’s nascent GSS bond market grew in 2020, with NZ$2.7 billion priced compared with NZ$2.1 billion in 2019 (see chart 16). Most of the growth achieved was in the agency space but corporate issuance also increased, by NZ$125 million.


INTERMEDIARY LEAGUE TABLES
In KangaNews all-Australian dollar league table – which covers all domestic syndicated deals, including sovereign issuance and the whole Kangaroo market but excludes self-led deals – ANZ maintained its hold on the top lead-manager position for 2020.
Just behind ANZ was UBS – which participated in almost all the AOFM’s syndicated deals throughout the year. Commonwealth Bank of Australia (CBA), Westpac Institutional Bank and Citi took the next three places.
The KangaNews league table for all domestic Australian dollar issuance – which excludes Kangaroo volume – contained an identical top five, while UBS and ANZ swapped positions in the local sovereign and semi-government league table.
National Australia Bank (NAB) maintained its top spot in the Australian dollar credit league table, which comprises local financial-institution and corporate issuance, with ANZ a narrow second followed closely by CBA and Westpac.
In the Kangaroo league table, TD Securities wrested back first place from Nomura in 2020. Nomura finished second with NAB, ANZ and RBC Capital Markets rounding out the top five.
NAB once again took out top spot in the KangaNews Australian dollar securitisation league table, with more than double the volume of Westpac in second place – A$7.6 billion versus A$3.6 billion. CBA, ANZ and Standard Chartered followed.
In New Zealand, ANZ retained top spot in the 2020 whole-market league table, which includes sovereign syndications, all other domestic bookbuilt supply and Kauri issuance. BNZ and Westpac Banking Corporation New Zealand Branch (Westpac NZ) took second and third again, with UBS clinching fourth ahead of Commonwealth Bank.
ANZ took back top position in the New Zealand domestic league table after being knocked off in 2019 for the first time since 2014, with Westpac NZ winning out over BNZ for second. UBS and J.P. Morgan took fourth and fifth place. ANZ also retained its position at the top of the Kauri league table.
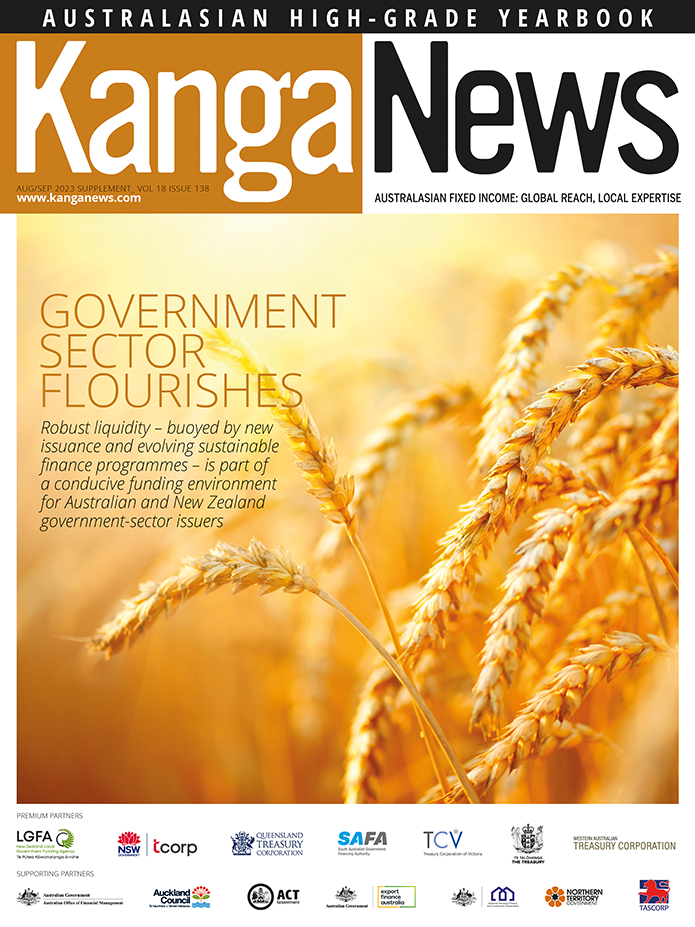
HIGH-GRADE ISSUERS YEARBOOK 2023
The ultimate guide to Australian and New Zealand government-sector borrowers.
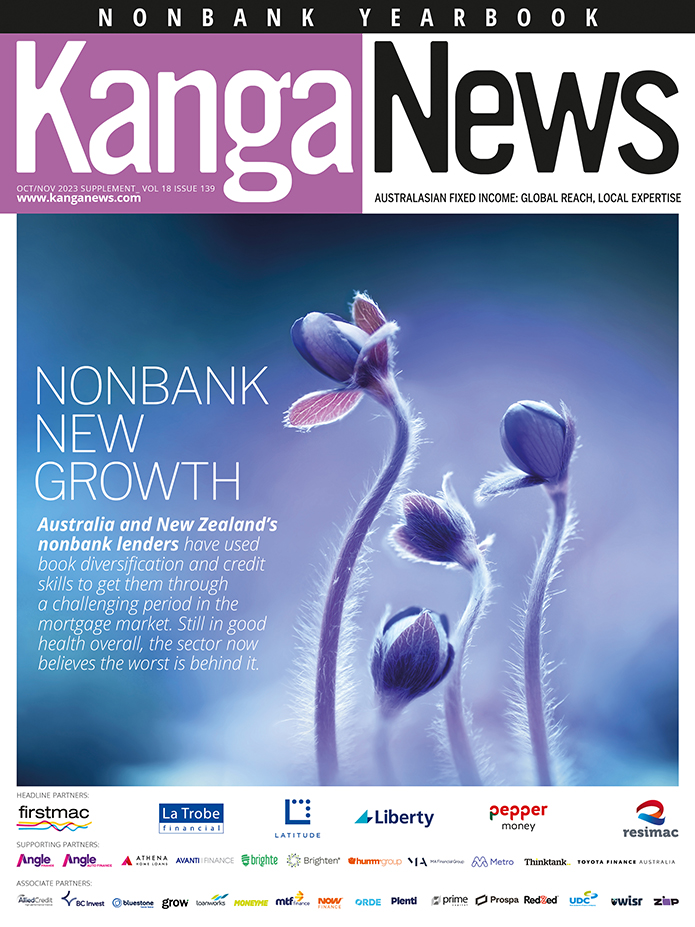
nonbank Yearbook 2023
KangaNews's eighth annual guide to the business and funding trends in Australia's nonbank financial-institution sector.

WOMEN IN CAPITAL MARKETS Yearbook 2023
KangaNews's annual yearbook amplifying female voices in the Australian capital market.
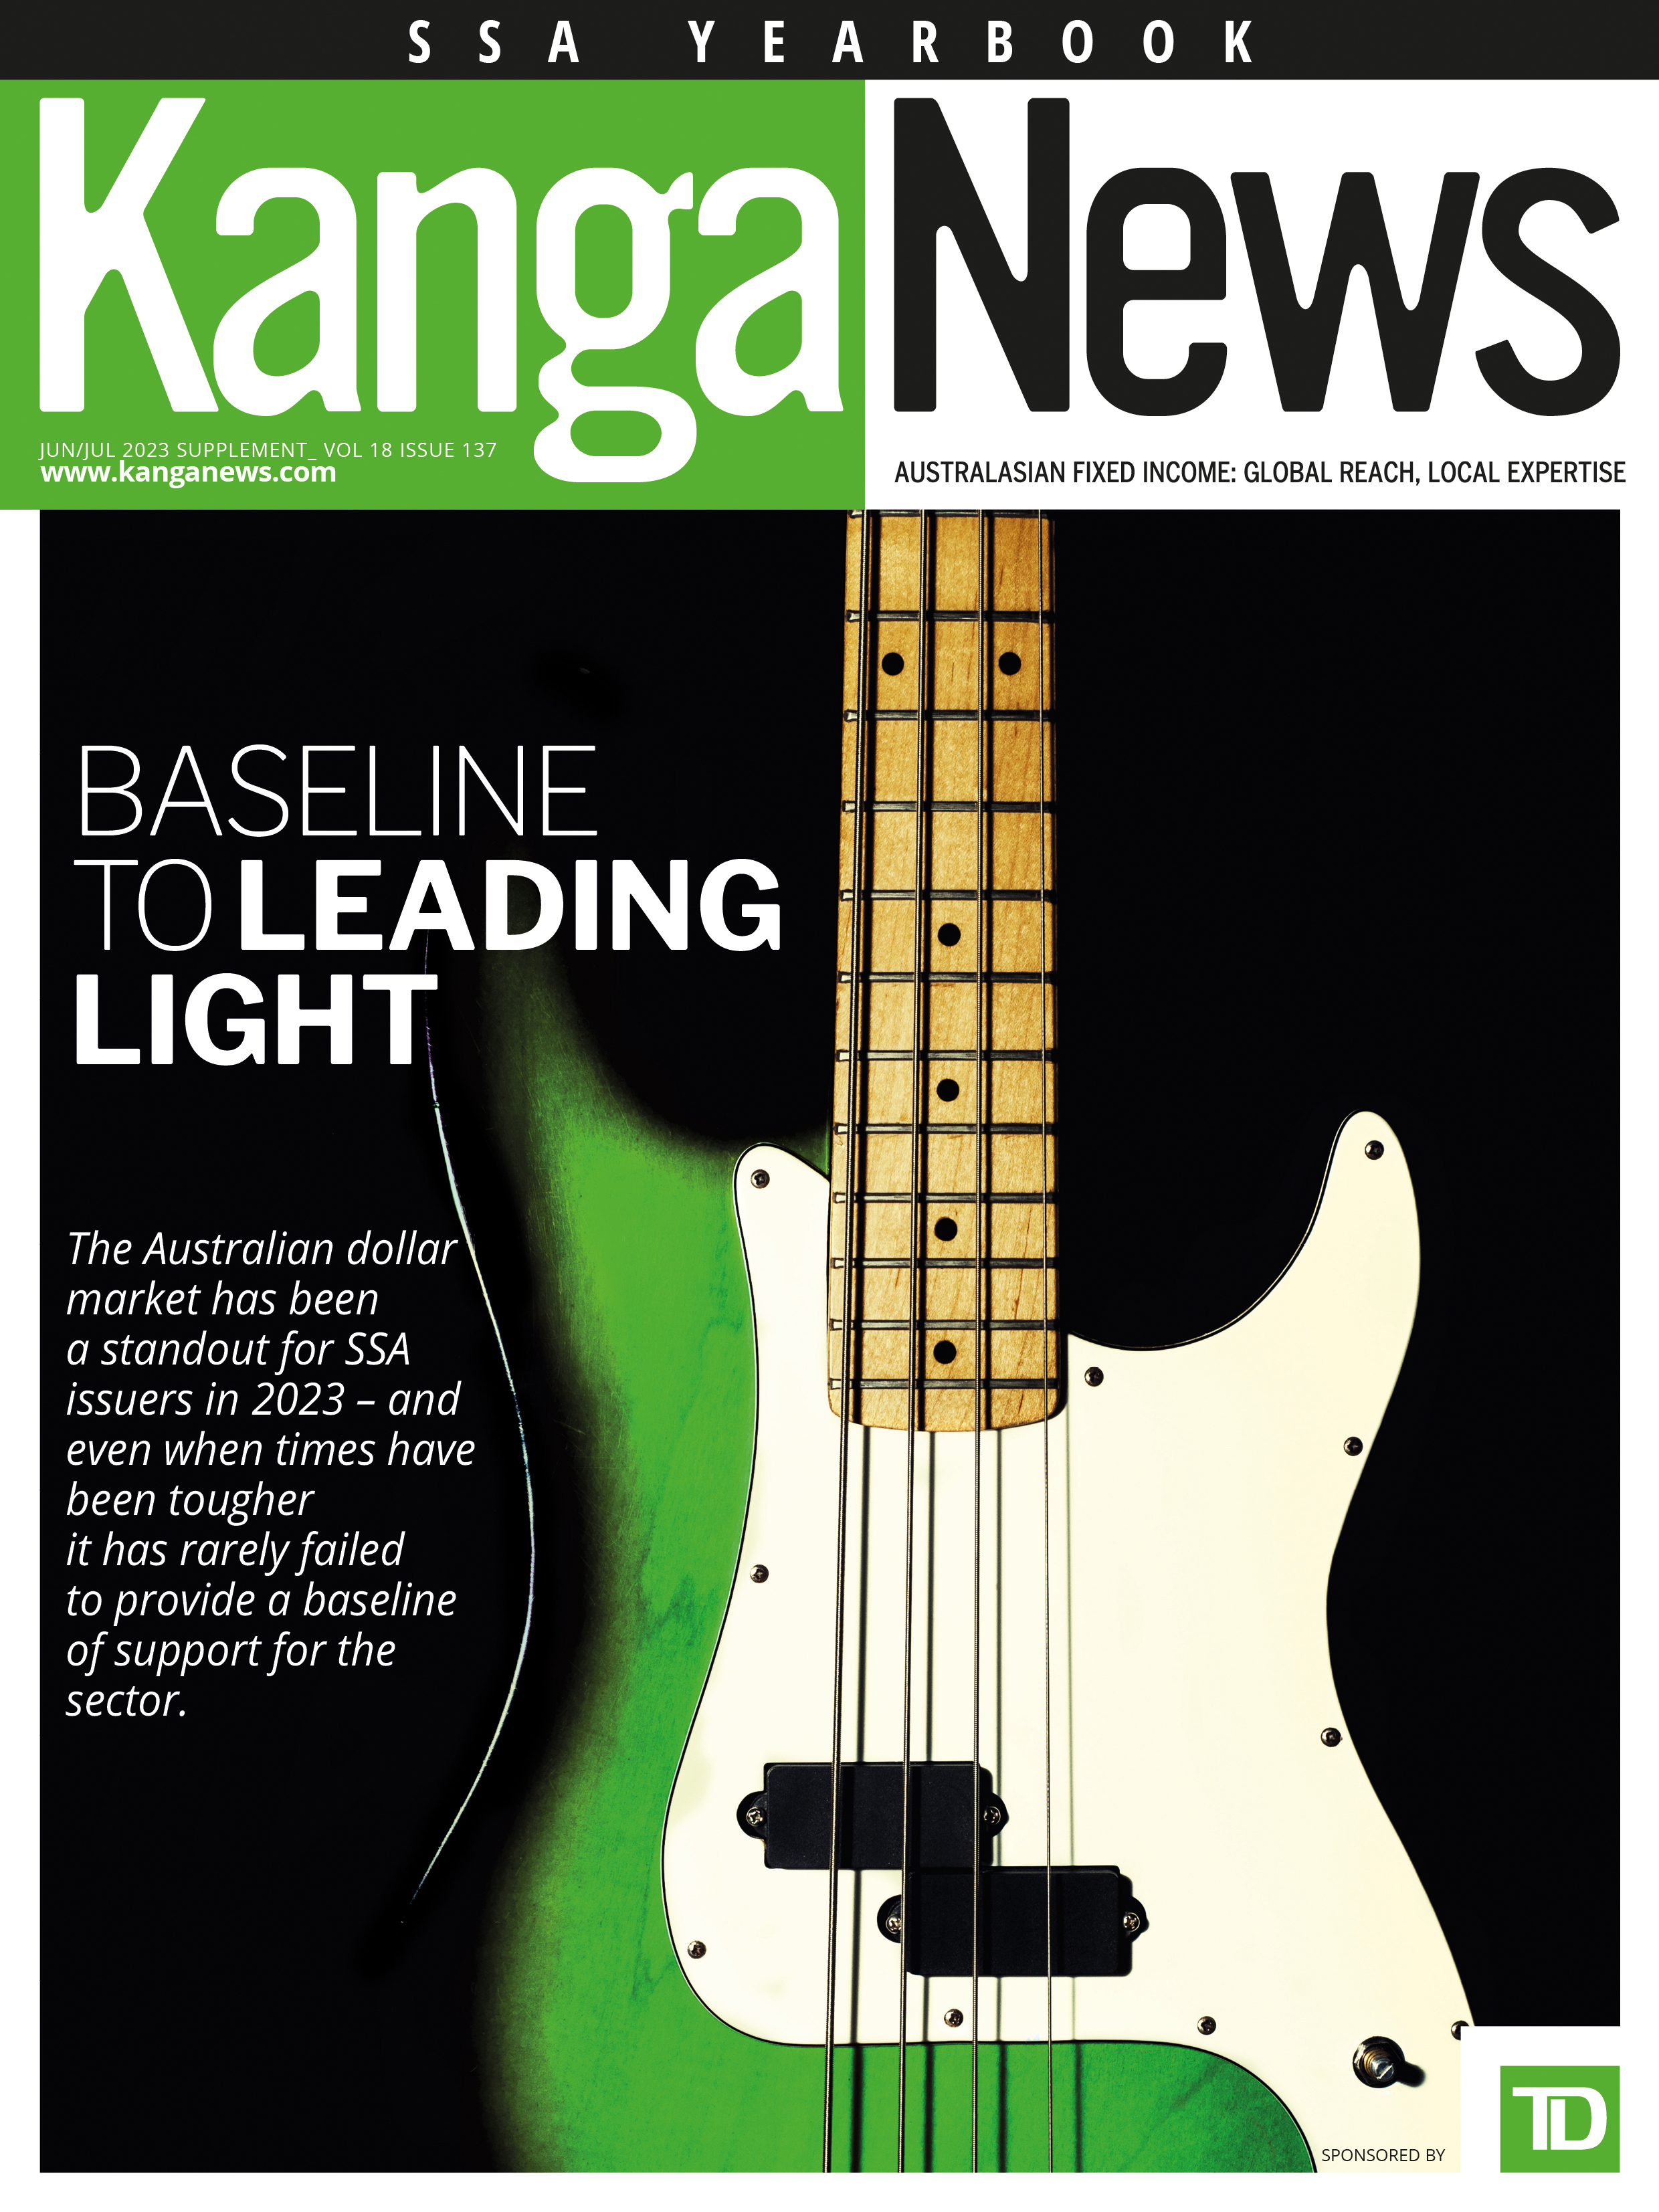
SSA Yearbook 2023
The annual guide to the world's most significant supranational, sovereign and agency sector issuers.


