Activity review: on the road to recovery
Lack of senior-unsecured supply from the major banks continues to represent a major hole in the Australian debt market, according to KangaNews issuance data from the first half of 2021. Meanwhile, sovereign and semi-government issuance has receded from the heights of last year.
Chris Rich Staff Writer KANGANEWS
Australian syndicated issuance excluding the sovereign was down on the year prior in H1 2021. The A$57.4 billion (US$42.2 billion) of combined credit and nonsovereign rates issuance is not out of line with typical issuance totals of A$50-65 billion but still represents the lowest first-half issuance volume since 2017 (see chart 1).
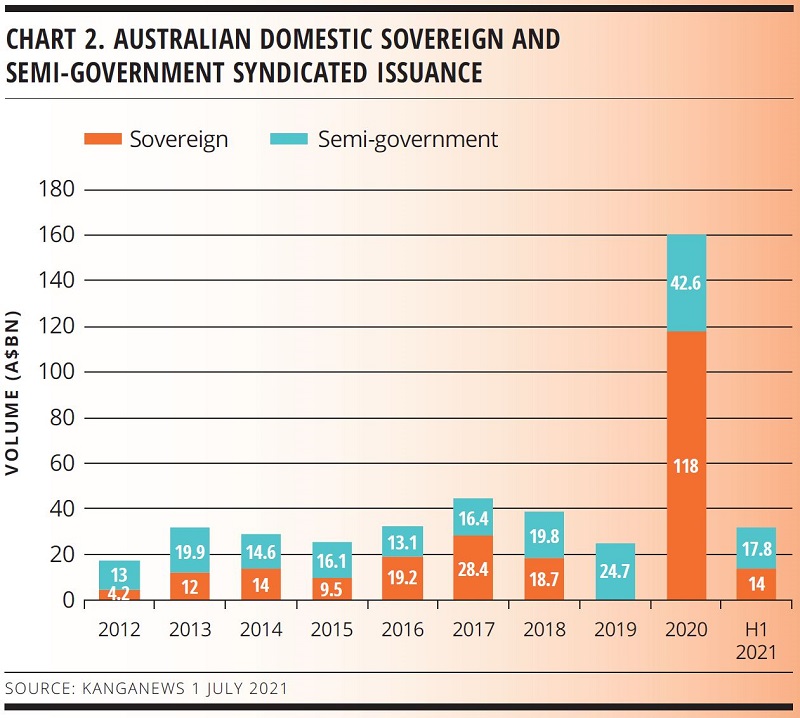
Though the first half did not see as much government-sector supply as 2020, when economic support caused issuance requirements to balloon, supply remains elevated. Syndicated semi-government issuance for H1 was A$17.8 billion – almost reaching the year-end totals of previous years (see chart 2).
With most of Australia’s states re-entering lockdown in the new financial year, it is unclear what impact there will be on federal- and state-government budgets. For now, issuance forecasts are in general lower than originally anticipated in the second half of calendar 2020, but most semi-government borrowers are still projecting historically elevated funding requirements for financial year 2021/22.
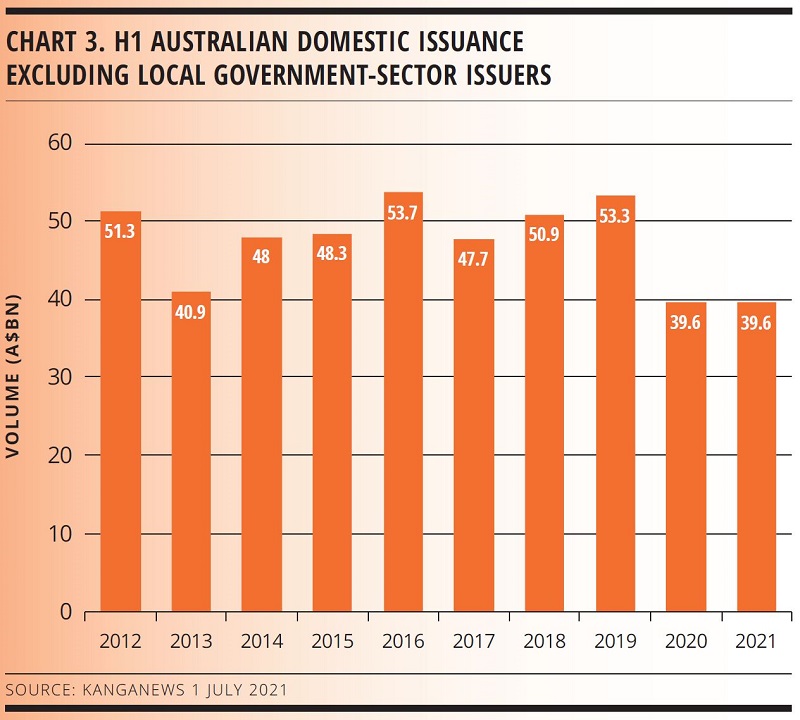
Nongovernment issuance volume in Australia in H1 2021, of A$39.6 billion, is almost identical to last year’s total but well down on pre-pandemic figures (see chart 3). The story behind the drop is the near absence of Australian domestic banks from wholesale issuance, in particular the big four, as the sector has continued to find ample funding from deposits and – until recently – the Reserve Bank of Australia (RBA).
Major-bank issuance in H1 2021 remained minimal, having fallen from A$20.7 billion in 2019. New issuance from other domestic banks also dropped in 2021 even relative to last year (see chart 4).

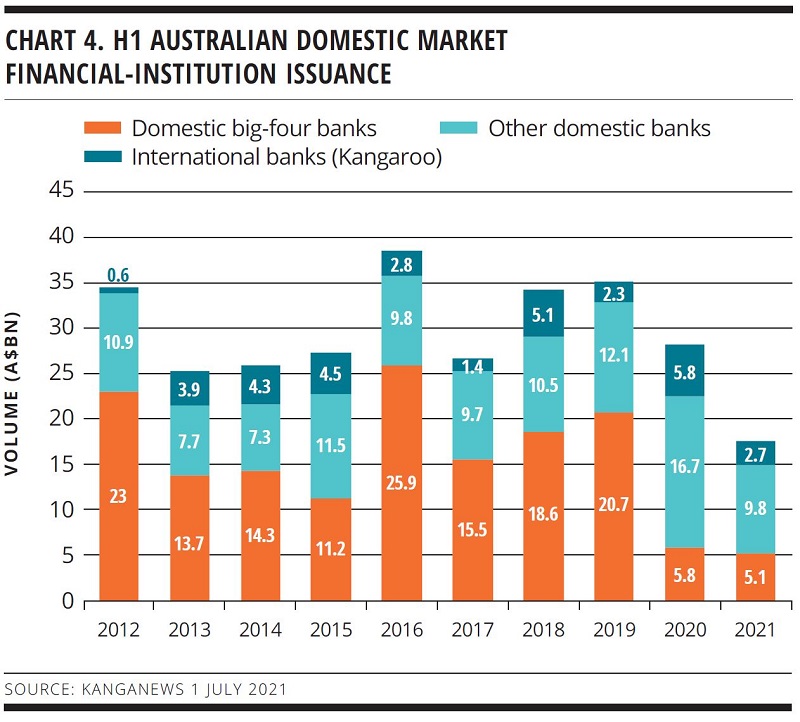
The RBA’s term-funding facility – which provided funding to banks originally at an interest rate of 0.25 per cent, cut to 0.1 per cent in November 2020 – ended after 30 June. The major banks historically comprise a significant slice of Australian credit supply and market participants expect them gradually to re-enter it and other public markets as 2021 progresses.
Deal flow has started. Westpac Banking Corporation’s US$2.75 billion senior-unsecured print in May was the first senior term deal issued by an Australian bank since January 2020. National Australia Bank also issued a €850 million (US$999.3 million) 7.5-year covered bond in late June and returned to the domestic market for a A$2.75 billion print in August.
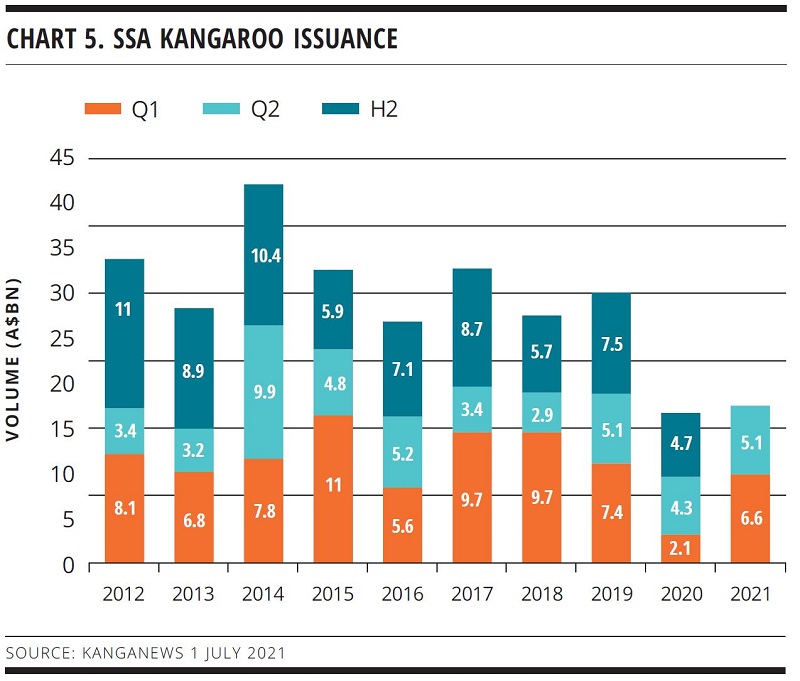
H1 2021 supply was bolstered relative to 2020 by a revived market for global issuers in Australian dollars. Cross-currency basis-swap costs and massive competing supply from the domestic government sector acted as a handbrake to the typical level of supranational, sovereign and agency (SSA) issuance in the Kangaroo market in 2020. But in H1 2021, SSA Kangaroo issuance jumped to A$11.7 billion – from A$6.4 billion in H1 last year – to be in line with historical trends (see chart 5).
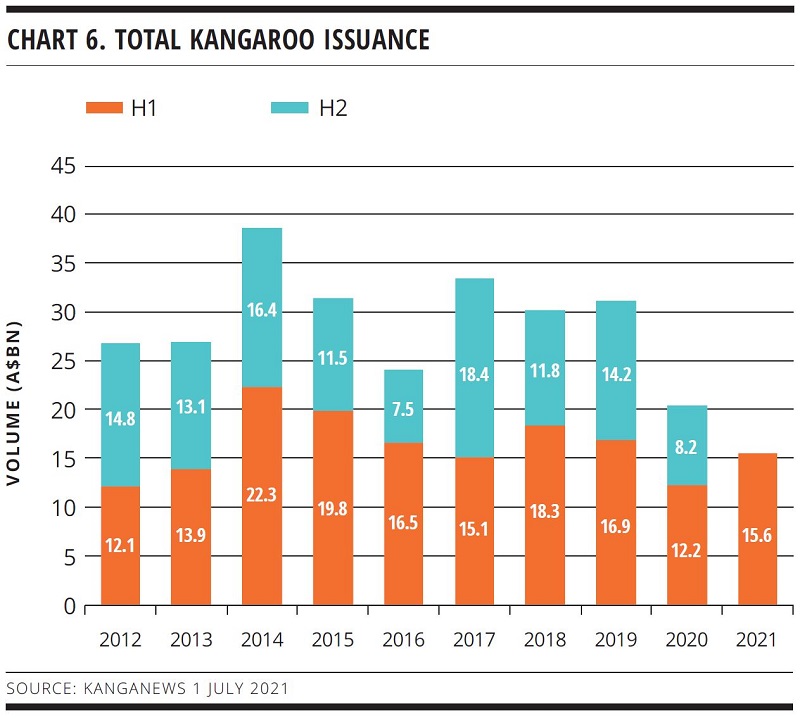
As a result, total Kangaroo issuance for the first six months of the year also jumped from last year despite less activity from international banks executing deals off Kangaroo documentation (see chart 6).
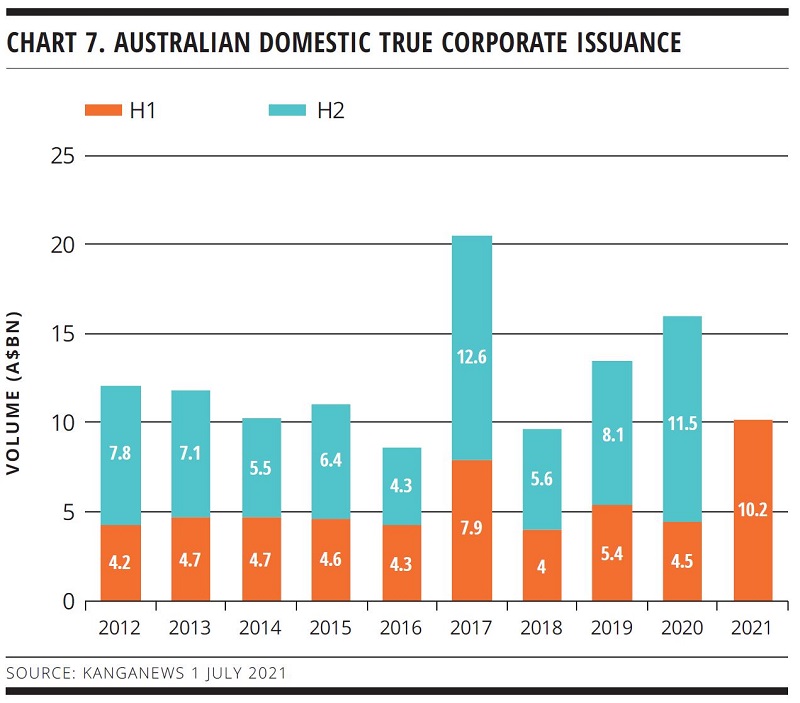
Australian dollar issuance from the corporate sector experienced its largest volume ever for the first six months of a year in 2021, at A$10.2 billion – even surpassing the bumper A$7.9 billion from 2017 (see chart 7). While a handful of jumbo transactions from the likes of Wesfarmers and Verizon Communications stood out in H1, it was returning issuers with more modest individual deal volume that really drove the market’s milestone print.
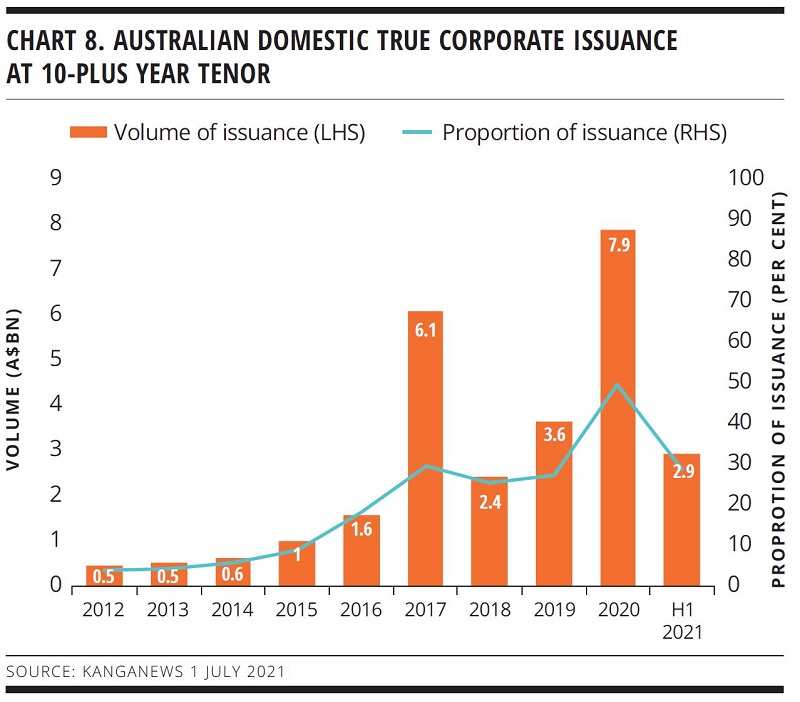
One of the trends in the corporate debt space in 2020 was the demand for extended tenor in response to the RBA’s record-low cash rate. H1 2021 corporate issuance shortened up, however. By the end of June this year, there had been A$2.9 billion of corporate issuance at tenor of 10 years or more, comprising around 30 per cent of total corporate issuance (see chart 8).
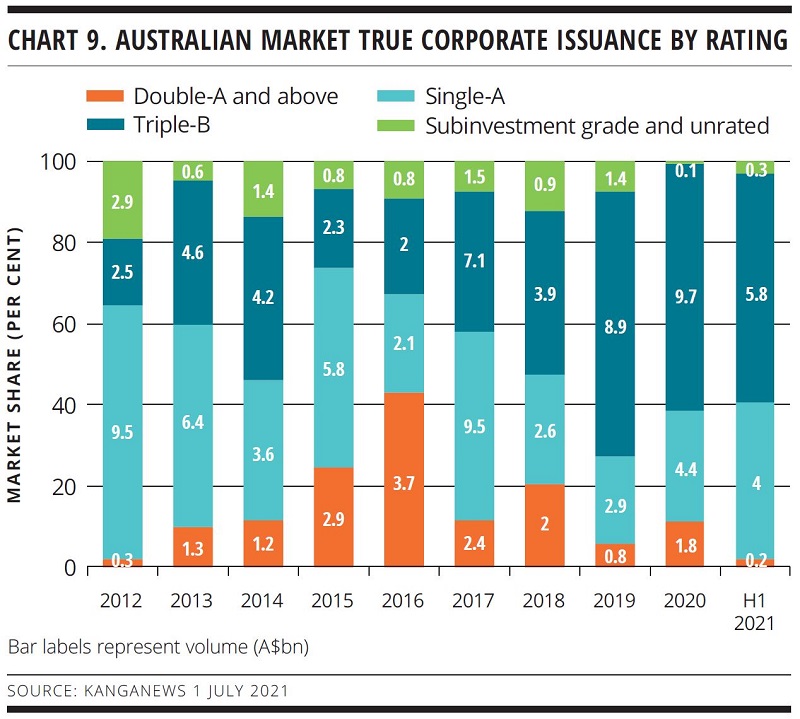
The proportion of triple-B, subinvestment grade and unrated corporate issuance in H1 was around 60 per cent of total supply – having broken the 60 per cent barrier in 2019 (see chart 9).
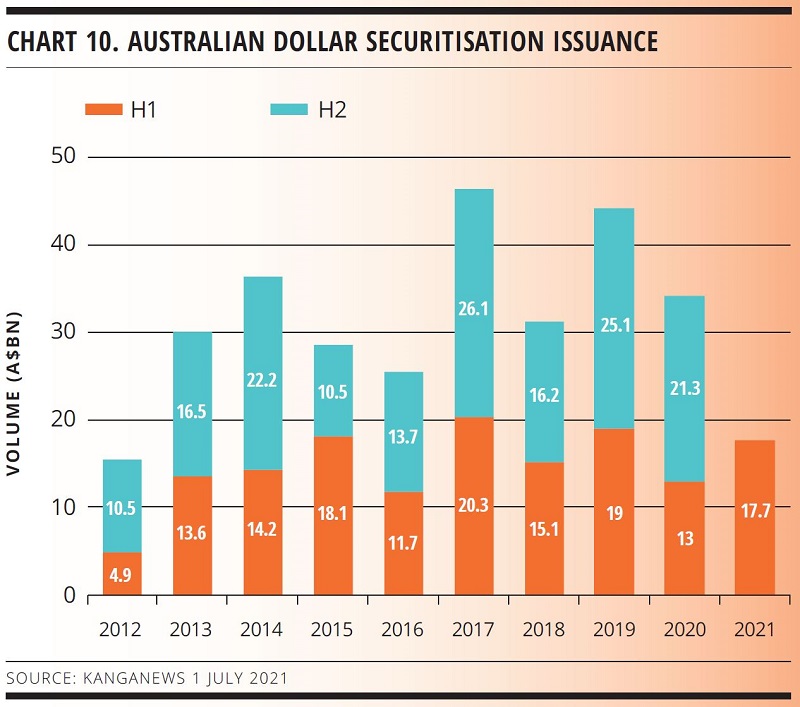
The absence of major-bank issuance has created a vacuum that securitisers – primarily from the nonbank sector – have gladly filled. Structured-finance issuance surged in H1 2021, to A$17.7 billion from A$13 billion the prior year (see chart 10).
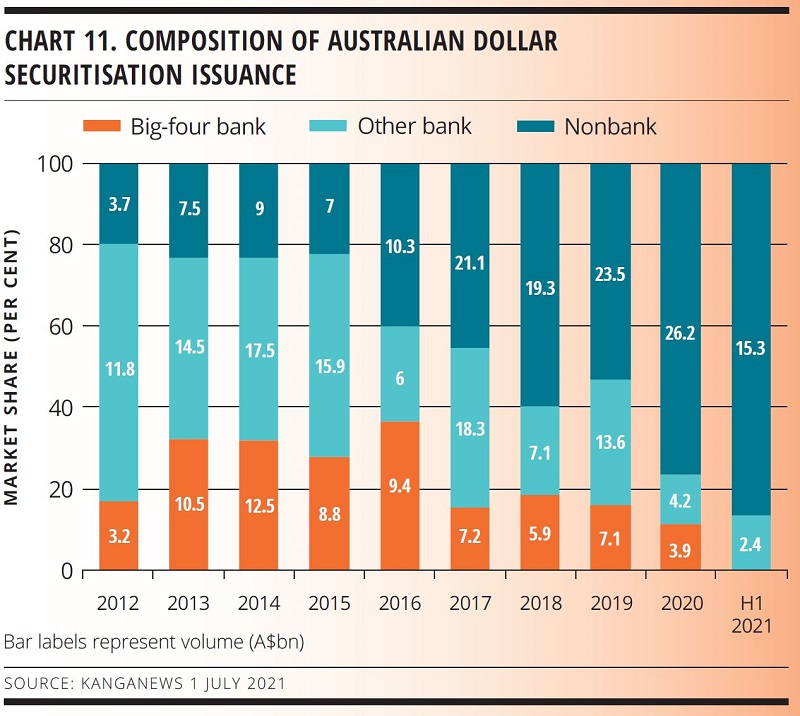
Nonbanks comprised A$15.3 billion of the total. Indeed, the nonbank composition of securitisation issuance has never been higher (see chart 11).
While banks have been able to draw on the TFF and rely on high deposit inflows to fund themselves during the pandemic – hence the lack of securitisation issuance from the sector – there has also been a broad-based surge in demand for housing that has in turn fuelled demand for housing finance.
This system growth since mid-2020 has seen nonbanks terming out larger transactions frequently, not to mention the fact that the sector continues to chip away at the lending-market share of the major banks.
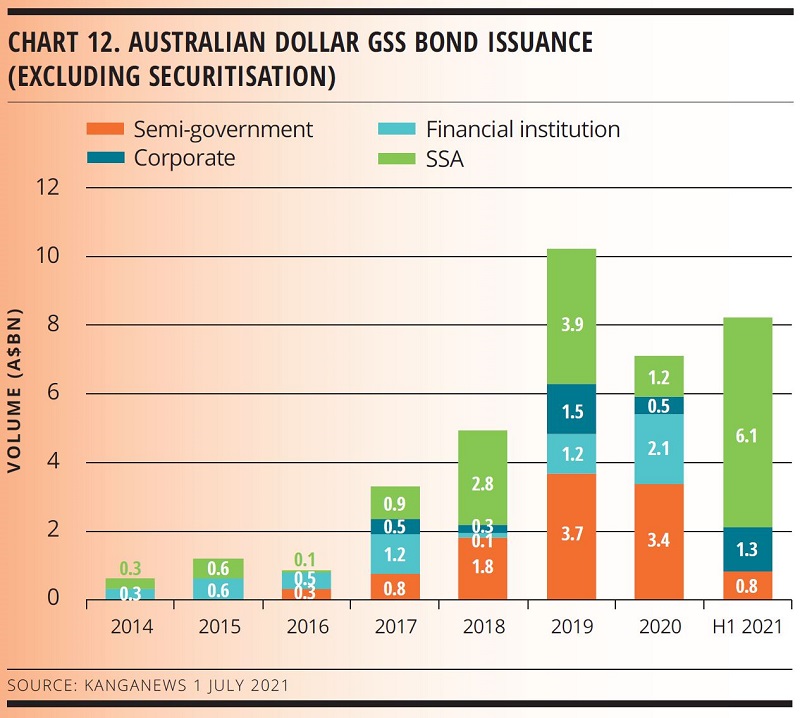
Australian dollar green, social and sustainability (GSS) bond issuance bounced back in H1 2021, having taken a back seat during the worst of the pandemic last year. Following 2019’s A$10.3 billion print there were high hopes for labelled bonds to continue their exponential growth, yet 2020 issuance totalled just A$7.2 billion. Deal flow for the first six months of 2021 – at A$8.2 billion – has already surpassed last year’s total (see chart 12).
SSAs have been the standout sector for GSS issuance with A$6.1 billion printed in H1. Naturally aligned to sustainable finance, several tailwinds have led to the bumper print, such as greater investor demand for labelled product, a wider and deeper asset base and cross-currency pricing working in favour of Australian dollars.
NEW ZEALAND SUPPLY
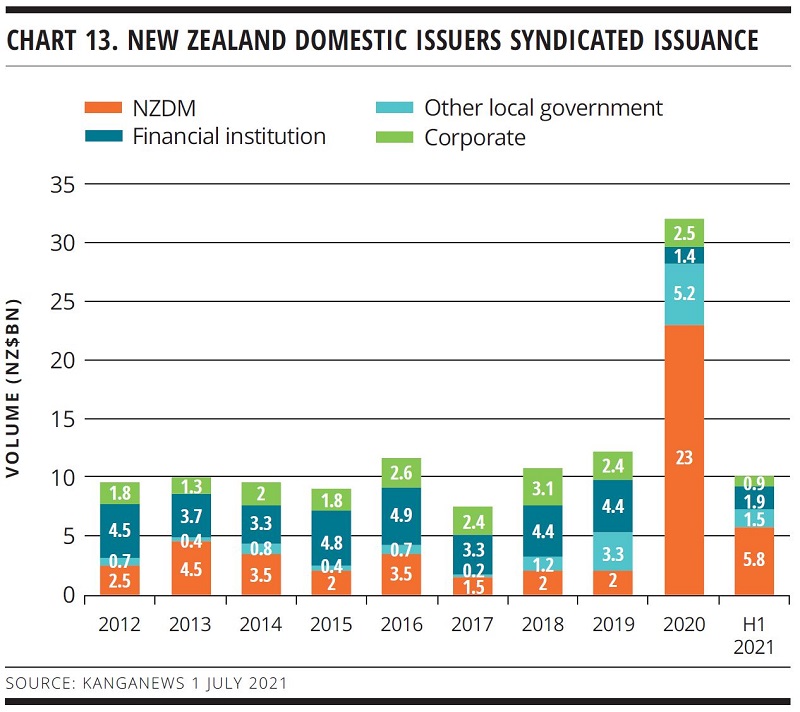
The New Zealand domestic market in H1 2021 was, like Australia, characterised by a drop-off in local sovereign and agency issuance in response to a quicker-than-expected recovery from COVID-19. In H1 2021, New Zealand Debt Management printed just NZ$5.8 billion (US$4.1 billion) via syndication – dramatically down on 2020’s year-end total of NZ$23 billion. Even so, H1 2021’s total issuance volume still surpasses the year-end totals of every other year prior to 2020 (see chart 13).
Unlike Australia, however, there has been a smatter of issuance from the New Zealand major banks. Financial-institution issuance in H1 2021 surpassed the year-end total of 2020.
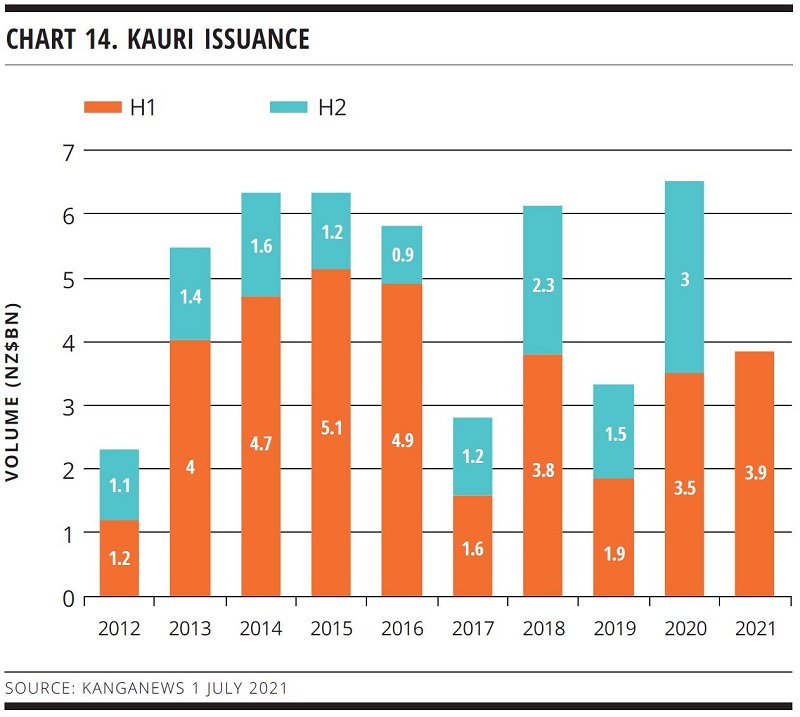
The cross-currency dynamics underpinning 2020’s record Kauri issuance from SSAs continued in H1 2021, resulting in NZ$3.9 billion of new Kauri supply – all from SSA borrowers (see chart 14).
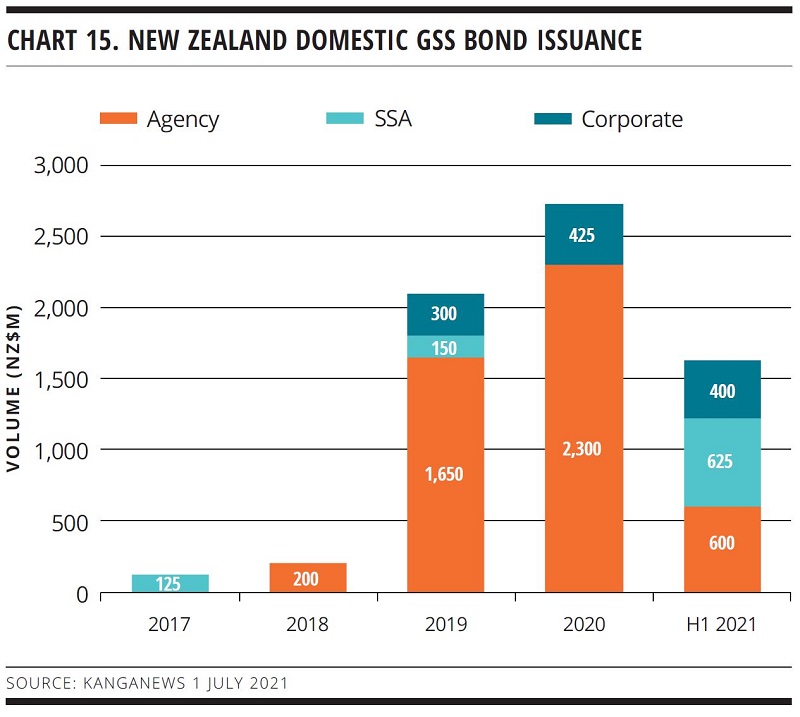
The heightened activity of SSAs in the Kauri market has translated into greater GSS issuance from the sector, with its largest-ever print of NZ$625 million. GSS supply from New Zealand corporates was also strong in the first six months of 2021, at NZ$400 million, almost equalling 2020’s year-end total (see chart 15).
HIGH-GRADE ISSUERS YEARBOOK 2023
The ultimate guide to Australian and New Zealand government-sector borrowers.
nonbank Yearbook 2023
KangaNews's eighth annual guide to the business and funding trends in Australia's nonbank financial-institution sector.

WOMEN IN CAPITAL MARKETS Yearbook 2023
KangaNews's annual yearbook amplifying female voices in the Australian capital market.
SSA Yearbook 2023
The annual guide to the world's most significant supranational, sovereign and agency sector issuers.

Related news