Under the hood of bank energy funding
At the end of February, BloombergNEF published its first Financing the Transition: Energy Supply Investment and Bank Financing Activity report. It found significant differences between banks in the ratio of funding they are providing to renewable energy relative to their fossil-fuel commitments – including within the Australian big four.
The aim of the report is to show what financing activity says about how the global banking community is supporting investment in energy transition. In previous analysis, BloombergNEF found that to displace fossil fuels to a sufficient degree to limit the average global temperature rise to no more than 1.5 degrees, the energy supply investment ratio (ESIR) – new investment in low-carbon energy supply relative to fossil-fuel supply – needs to increase to a minimum of 4:1, from the current 0.9:1, by the end of the decade.
For the new report, BloombergNEF created the energy supply banking ratio (ESBR) to assess banks’ energy sector financing activity in 2021, including the allocation between low-carbon supply and fossil fuels. In generating this ratio, BloombergNEF approximates the extent to which banks’ financing activity is aligned to investment in the real economy and, by extension, to 1.5 degree-aligned climate scenarios.
The report found that, in 2021, global banks on aggregate financed 81 per cent as much low-carbon energy supply as fossil fuels. This ratio broadly reflects real-economy investment activity. Bank financing for energy supply totalled US$1.9 trillion, of which US$842 billion went to low-carbon energy projects and companies while the balance went to fossil fuels. The real-economy equivalent figures were US$1.7 trillion and US$807 billion.
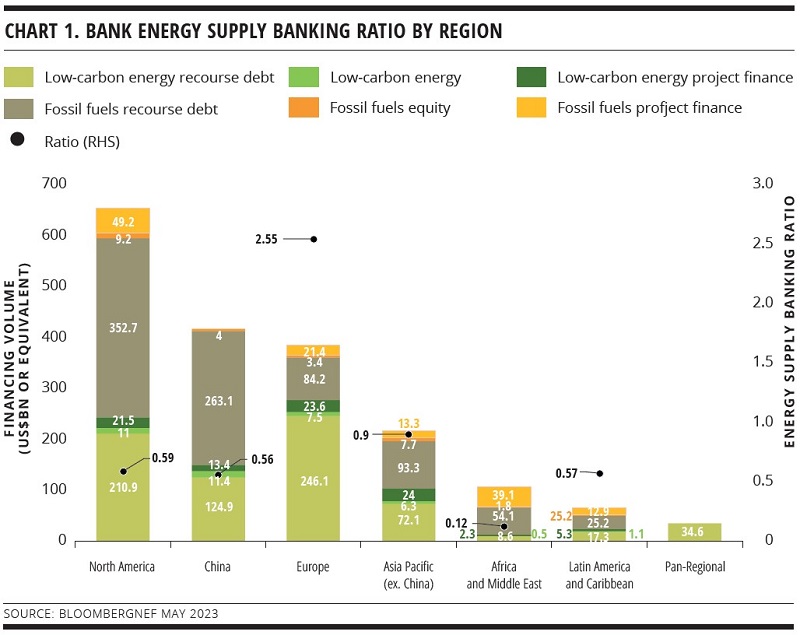
However, the ESBR varies significantly between regions (see chart 1): financing in North America and China was at 0.6:1 while Europe reached 2.6:1. Bank ratios are almost as varied: 1.4:1 in Europe, 0.7:1 in North America and 0.5:1 in China. BloombergNEF says this in part reflects the role each region plays in global energy supply and consumption.
In mid-March, KangaNews caught up with Jonas Rooze, London-based manager, sustainability and climate research at BloombergNEF and a co-author of the report, in Sydney to discuss the findings in more detail.
What is the report’s rationale?
ROOZE There has been a lot of focus on financing going into fossil fuels as the prime evil in the world. One of the challenges in this space is that we are all trying to solve the emissions problem but focusing just on emissions doesn’t always get us there.
We are in an energy crisis as a consequence of the war in Ukraine but also underinvestment by fossil fuel companies due to the demand reduction for energy as a result of the pandemic, combined with concerns about the longevity and viability of fossil fuel energy supply. All this has contributed to the high inflation we are seeing globally.
What we should learn from this is calls to ‘just stop’ fossil fuel investment don’t solve the problem. They are predicated on the IEA [International Energy Agency]’s statement that there should be no investment in new fossil fuel exploration and production. However, that is based on the assumption of global cooperation to minimise asset stranding. But the geopolitics are impossible: global cooperation is never going to happen. Also, if our goal is to minimise stranding, what we have now learned is that we are putting the world at risk of inflation – which is much worse because everyone suffers from it. Only the owners of the assets suffer from asset stranding.
Is this what led your team to explore the ESIR and create the ESBR to assess banks’ energy sector financing activity?
ROOZE Yes. We explored the scenarios and realised they don’t demand zero fossil fuel investment. In fact, when we looked at a number of the scenarios to find the investment levels for fossil fuels and clean energy supply, they were all over the place – because the scenarios are all over the place. Some are based on extremely low demand growth, low population growth and everyone moving to cities. Others are completely different.
This is why we came up with the idea of the ESBR. It was actually Carl Pope, former director of the Sierra Club, who came up with this idea. He is advising Mark Carney on the Glasgow Financial Alliance for Net Zero (GFANZ) and it is within this context that we created the report.
The report identifies a hierarchy of banks: 30 GSIBs [global systemically important banks] and 126 banks in the Net Zero Banking Alliance (NZBA) that have committed to net zero financed emissions by 2050 under the GFANZ, and banks that are not in the alliance. In other words, the report highlights very different performance across the banking sector.
ROOZE That’s right. The ratios are a lot further away from where the scenarios say clean energy should be than from where they say fossil fuel investment should be. We are only 10s of percentage points above where we should be on fossil fuel investment, whereas we are multiples below where we should be on clean energy investment. We can’t get rid of fossil fuels without displacing them. This is how we prevent inflation: by displacing fossil fuels, not by stopping them and doing nothing with the gap.
Is the issue with renewable energy investment that there is still a gap to be closed in development of technology?
ROOZE On the contrary: a lot of the technology is already there, and in scale – though it is true that there are some hard-to-abate sectors with technology in development.
The underinvestment issue is a matter of scale: we are having to displace a massive energy system and this quickly gets into a question of how to scale. This is not just a problem of access to finance, it’s an everything problem – it is a supply chain problem, a policy and subsidy problem, a skills problem. This is really the problem we should be solving, rather than telling banks they are bad to continue to finance fossil fuel investment.
“We can’t solve the problem we are facing with knee-jerk reactions. Our analysis has built a better stick compared with the one banks are being hit with at the moment. It is not easy to admit we are building a stick, but we think it will be more useful than what is out there.”
Were you surprised to find that there is such a correlation between the ESIR and the ESBR?
ROOZE It is amazing. We created the EBSR to see where banks are now – and found that they are at the same level as the economy as a whole. We did the bank analysis on a bottom-up basis, looking at tens of thousands of individual loans, bonds and project finance projects. This took us a year – there was an enormous amount of work involved to develop the methodology for this.
It is not the same money because the funding a company gets from a loan or a bond is not necessarily the same amount of money that goes into a project. The comparison isn’t one-to-one but the fact that the levels are so similar is a very good sign.
Was underwriting of bonds included in the ESBR?
ROOZE Yes. What we didn’t do is measure direct lending by banks as part of their loan portfolios. A lot of banks lend the money in a syndicated loan but they are not included because these data aren’t often available. Because the loan market is private, we may be missing some data – especially if the loan is not syndicated. Ideally, this becomes an item banks will report on so we can capture more data and the ratios become more accurate.
What we are measuring is who is facilitating the financing. It is the same with bonds: we don’t look at who bought the bond, rather at who did the underwriting for it.
Why did you decide to analyse this on the basis of a ratio rather than looking at scenarios?
ROOZE Zero is a very easy target, which is why net zero is so attractive – no-one has to argue about how to divide zero. Whereas global climate negotiations have always been arguing about how to divide a non-zero number. A ratio number can be broken down by individual institution with the ratio applied as a benchmark. It’s a beautiful concept.
We came away realising that the banks as a whole have very similar ratios. In individual groupings of banks, we found that, generally, GSIBs do a little better than the average while those banks in the NZBA do a little better than the rest.
Remember that this analysis is based on data from 2021, which is pretty much when most banks joined the alliance. It will be interesting to see how 2022 played out. We would like to update the report ahead of COP28 at the end of November 2023.
We also noticed that larger banks have slightly lower ratios than smaller banks. This has a lot to do with the fact that large banks have big relationships – and when we talk about big relationships in the context of energy, we are inevitably talking about fossil fuel companies. There are no super-major clean energy companies and the economy as a whole is largely a fossil fuel economy.
There are also interesting regional differences. For example, the two European banks in the global top 10 have ratios that are much better than the others.
ROOZE It is clear that the European region is encouraging more clean energy investment. But it is also not a big energy producing region compared with others. Some very large oil companies are based in Europe but much of their production is not based in the region. The energy crisis is also accelerating the energy transition in Europe.
“Calls to ‘just stop’ fossil fuel investment don’t solve the problem. They are predicated on the IEA’s statement that there should be no investment in new fossil fuel exploration and production. However, that is based on the assumption of global cooperation to minimise asset stranding. But the geopolitics are impossible: global cooperation is never going to happen.”
Sustainable finance is becoming more complex. Integrity is of course paramount, but greenhushing could also be stopping companies from making commitments about transition. The ESBR can show banks where they stand – but how important is it that the numbers are viewed in a nuanced way?
ROOZE There is general recognition that we are trying to solve the emissions problem but focusing on emissions is not the most effective way. A system change needs to happen but just focusing on emissions creates a lot of poor incentives, such as divestment. The nuance is really important.
What the IEA said regarding no new fossil fuel investment is a very effective slogan – it works well from that point of view. But we can’t solve the problem we are facing with knee-jerk reactions. Our analysis has built a better stick compared with the one banks are being hit with at the moment. It is not easy to admit we are building a stick, but we think it will be more useful than what is out there.
We have used some of the methodologies from NGOs in creating our analysis. For example, we have worked with the Rainforest Action Network (RAN) to adapt some of their methodology for our work. They did some clever things with the Banking on Climate Chaos report, which we liked. We used some of their methodology, particularly regarding adjustments.
For example, if money is going to a fossil fuel company, we could be simplistic and calculate all of it as being allocated to fossil fuel financing. But if we know the company makes 10 per cent of its revenue from clean energy, we can make an adjustment on this basis.
RAN scooped us a couple of months ago – together with the Sierra Club, BankTrack and Fair Finance International it published its own version of this kind of analysis. For the first time, this studied clean energy and fossil fuel investment together, with their own ratios. This shows that others are appreciating the nuances required. Hopefully, the narrative is changing for the better as a result of this work.
Are GFANZ or NZBA using the data?
ROOZE Not formally, but we appreciate their input into the report. There is a hope that what we are doing here will change the narrative to some degree – but at the moment there is no formal use of our ratios. We have presented to the board of the NZBA about this work.
How did you incorporate green, social and sustainability bond issuance in your analysis?
ROOZE We looked at use of proceeds (UOP) and we only picked up those that were relevant from an energy supply perspective. The UOP is at the framework level – it is stated up front by the issuer, ahead of bond issuance.
The language on UOP tends to be quite broad, generally including a few themes. If, for example, two out of six potential UOPs relate to energy supply, we used this to calculate how much of a bond issue goes into our numbers. For sustainability-linked issuance, which is for general corporate purposes, the amount is calculated based on the entity – apportioned either by its revenue split or more detailed data if we have it.
We tried to do some work to compare what we were doing to what the banks are disclosing on strategy, commitments and current activity. It is almost impossible, though – because they are all measuring things differently.
Most of the time, emissions strategies will have a sustainable financing target that is all-encompassing. A bank will say, for example, that it is putting US$1 trillion into sustainable financing. But this could be anything. It may be fine – but how do we track it? Meanwhile, maximising what a bank is financing in sustainable debt doesn’t mean it is maximising the sustainable things it is doing overall.
The market is effectively going through a correction right now, for good reason. The volume of sustainable debt dropped last year. This was alongside a fall in debt issuance as a whole, but I believe the fall in UOP and sustainability-linked issuance also happened because market participants have started to realise that nuance and detail is important and not everything labelled is great.
How do Australian Banks fare?
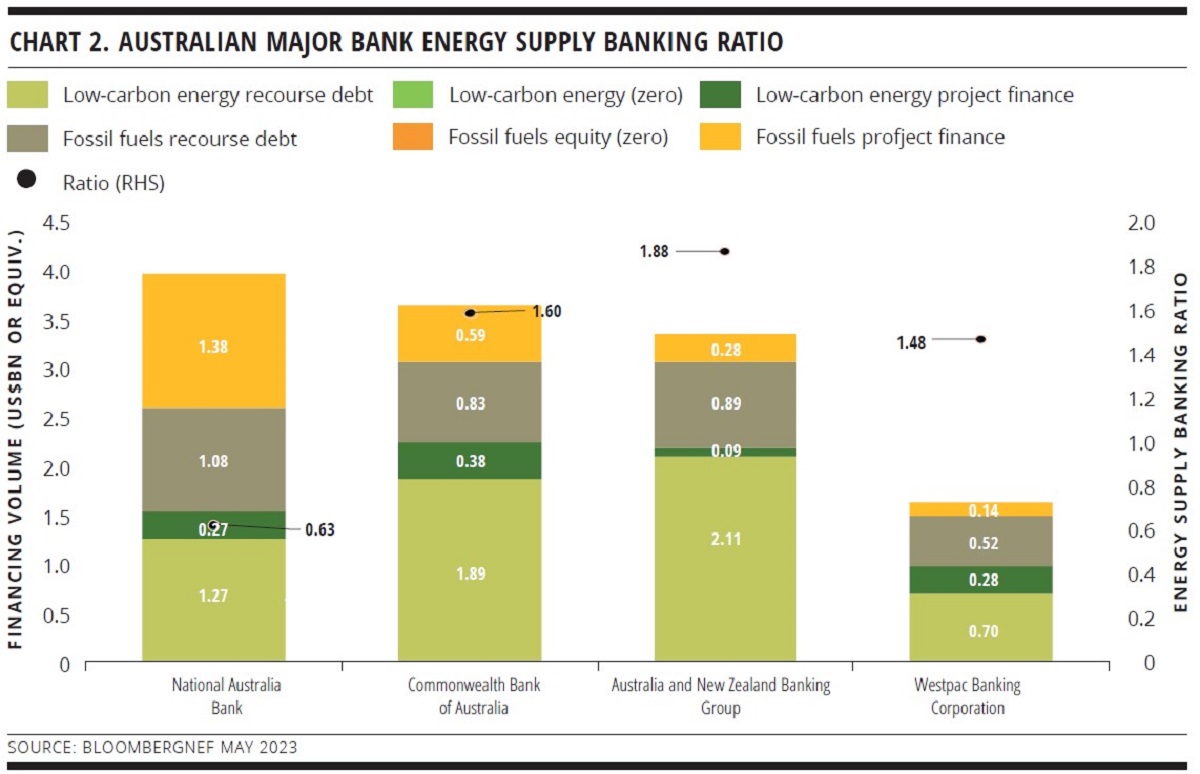
Australian banks compare relatively well with global peers when it comes to energy supply financing measured by bank headquarters. However, not all of the big four Australian banks fare the same under BloombergNEF’s energy supply banking ratio (ESBR) (see chart 2).
ROOZE Generally, there has been a good reaction. Banks want to know how they compare and some are nervous. But overall the reaction has been quite positive – they realise there is a need for this kind of analysis.
At the moment, the metric for success is financed emissions. But the only incentive financed emissions creates is to get fossil fuel investments off the books. This doesn’t necessarily change the world. Banks are also living in a world where a new report about their level of financing to fossil fuels comes out every two or three months.
ROOZE The report shows that all regions but Europe have an ESBR below 1:1. Europe’s ratio is 2.6:1, while that for North America and China is 0.6:1, and Asia Pacific excluding China has a ratio of 0.8:1. When it comes to energy supply financing by bank headquarters in 2021, North American headquartered banks have an ESBR of 0.7:1, European banks have an ESBR of 1.4:1, and Asia Pacific excluding China banks’ ESBR is 0.7:1. Australian banks are included in the Asia Pacific.
We have calculated the overall ESBR for Australian banks specifically: the big four plus “others”. The Australian bank ESBR is 1.3:1, while by region of risk Australia has a ratio of 0.6:1. The ESBR of 1.3:1 is closer to Europe’s ratio than other regions.
This mirrors other data I have looked at, such as sustainable debt issuance, fund flows and alignment to the Taskforce on Climate-Related Financial Disclosures – where Australian banks are behaving more like Europe than other countries in the Asian region.
ROOZE The EBSR starts to expose which banks do not have the capability one would hope for to finance clean energy. The ones with the lowest ratios have the most to do.
There are two ways to improve a ratio: stop financing fossil fuels or finance more clean energy. Stopping fossil fuel financing on its own is not the best way because we need to build out the low-carbon energy system, and in any case a bank would be cutting off its nose to spite its face because it would literally be turning down business.
But if a bank wants to be well positioned for the future and to have an energy underwriting business in the future, it clearly should be ramping up its financing to renewable energy.
WOMEN IN CAPITAL MARKETS Yearbook 2023
KangaNews's annual yearbook amplifying female voices in the Australian capital market.


Related news